
6/9/26 : Comparing Painters
- Steve Potter

- 6 days ago
- 2 min read
Andrew Painter’s most successful season to date (at least statistically) was in 2022 when he skyrocketed thru the system going from Low A Clearwater to AA Reading. Then came the two lost seasons as a result of Tommy John surgery with a return to the mound in 2025 at Lehigh Valley.
This season he’s struggled finding consistency with his fastball in regard to command and effectiveness. So me being the brainiac that I am 🤪 I took at look at data from the two seasons 2022 (only Clewarwater data is available) & 2026 to see if there are any tips as to what may be the cause. Here goes - just focusing on the fastball till the last chart.
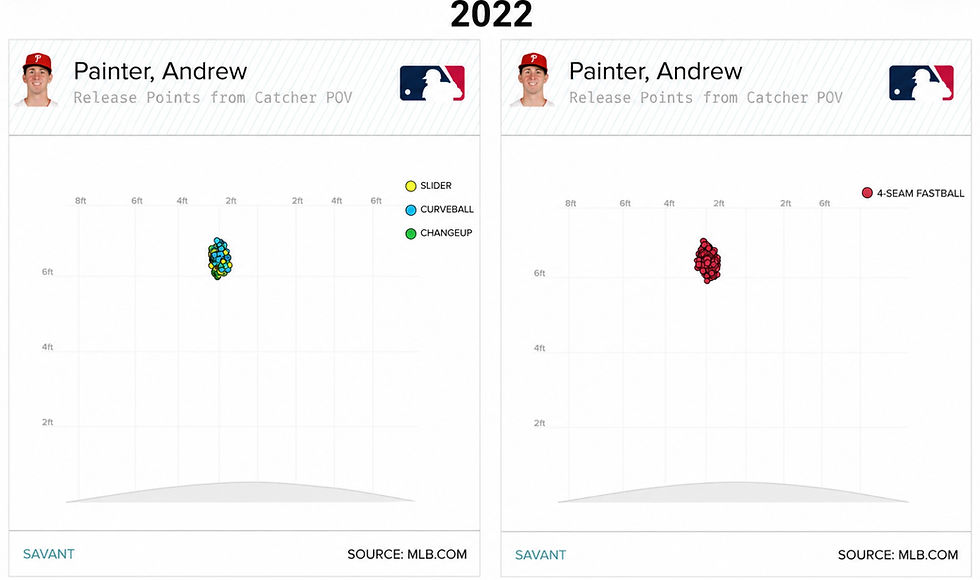
Release Points (as charted from Catcher POV)
Baseball Savant has a chart that tracks release extension and release height/side. It’s used to evaluate deception primarily but links to velocity as well. In 2022 according to the chart Andrew was releasing his fastball to the right of the rubber consistently between one to three feet with the majority over the two foot range. Height wise it reflects most every pitch above six feet with the cluster above six and a half but below seven. This season’s chart shows a lower release height and his horizontal release closer to the center of the rubber. From my perspective when I saw him in the minors he got better deception at the higher extension when releasing the ball closer to his body.

Spin Rate :
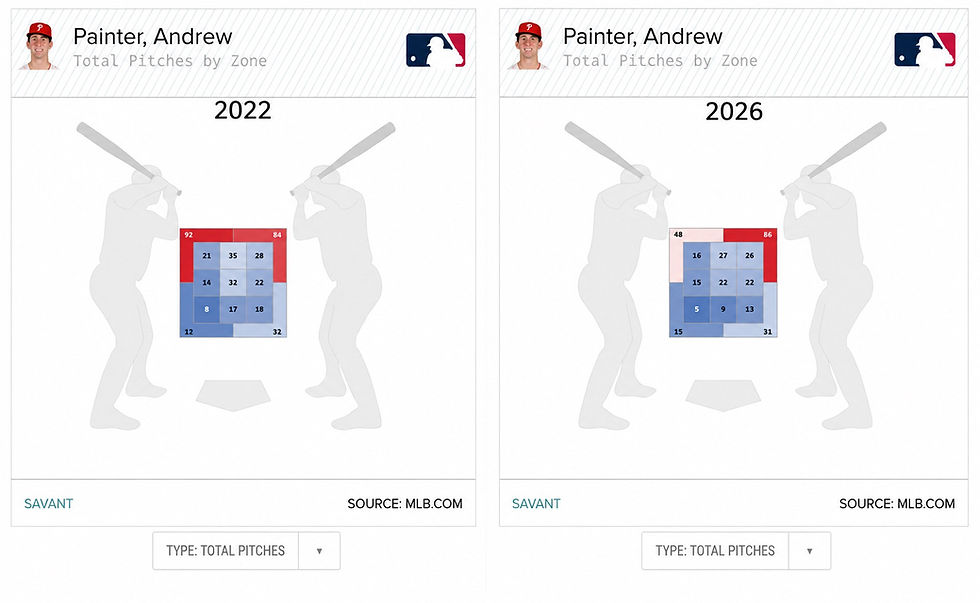
In the data capture from 2022 Andrew’s spin rate on his fastball generally sat in the 2300 to low 2500’s with it occasionally hitting above 2600. Velocity ranged from 94 to 98 mph with flashes of 99 to 100. His pitch zone predominantly lived on the upper edges. This season the spin rate is ranging lower sitting in the upper 2100’s to low 2300’s - only on a few occasions has it went above 2400. Velocity has ranged from 94 to 98, no instances shown of triple digits. The zone profile reflects less pitches upper pitcher arm side, and more upper pitcher glove side which aligns with the release point reflected.

Pitch Movement :
The higher up on the chart a fast ball sits indicate more swing and miss capability as the ball stays flat albeit giving the impression of rising thru the zone. Comparing Andrew’s data from year 2022 to year 2026 reflects pitches with less rise and arriving more to the center of the plate.

Release Point Comparison to other pitches :
Lower release on all pitches as compared from year 2022 to year 2026

As a consultant used to tell me “Tis only data” unless ya use it for something. I’m sure this isn’t new discovery for the team - just an old man trying to ascertain why such a talent is struggling. Maybe there’s an answer here - just sayin 🥸
Happy Day, Happy Baseball ⚾️
Note : I've partnered with Fanatics on Phillies Merchandise - if you would like to help support my website and articles here's a link to order merchandise - I get a small commission on any sales - thanks for the support.


Comments